
REA (Reverse Engineer Anything) is an open-source tool that lets an AI agent take apart software you are allowed to inspect. You ask a question about a feature, such as “how does copy and paste work in this desktop app?” The agent then uses REA to look through the app’s shipped files or compiled machine code, and explains what it found. [1]
The project calls itself “one MCP for reverse engineering across binaries, applications, and runtime behavior.” In plain terms: one connection gives your agent decompilers, app unpackers, and runtime capture, so it can follow a feature from the button you click down to the code behind it.
A bridge, not a new decompiler
REA is a local MCP server and command-line tool, distributed on npm as rea-agents under the MIT license. It is not a model and not a new decompiler. It is the connector between an AI agent and the analysis tools that already exist. [1, 2]
Three roles are worth separating:
- The agent (Claude Code, Codex, Cursor, and others) decides what to look at next, reads the results, and writes the explanation or code.
- MCP (Model Context Protocol) is the plug. It is the standard way the agent discovers and calls REA’s tools. MCP itself does no analysis.
- REA turns each tool call into real analysis work. It drives a native engine such as Ghidra, IDA, or Hopper, or uses built-in readers for JavaScript, .NET, Android packages, and websites. Then it sends back structured results.
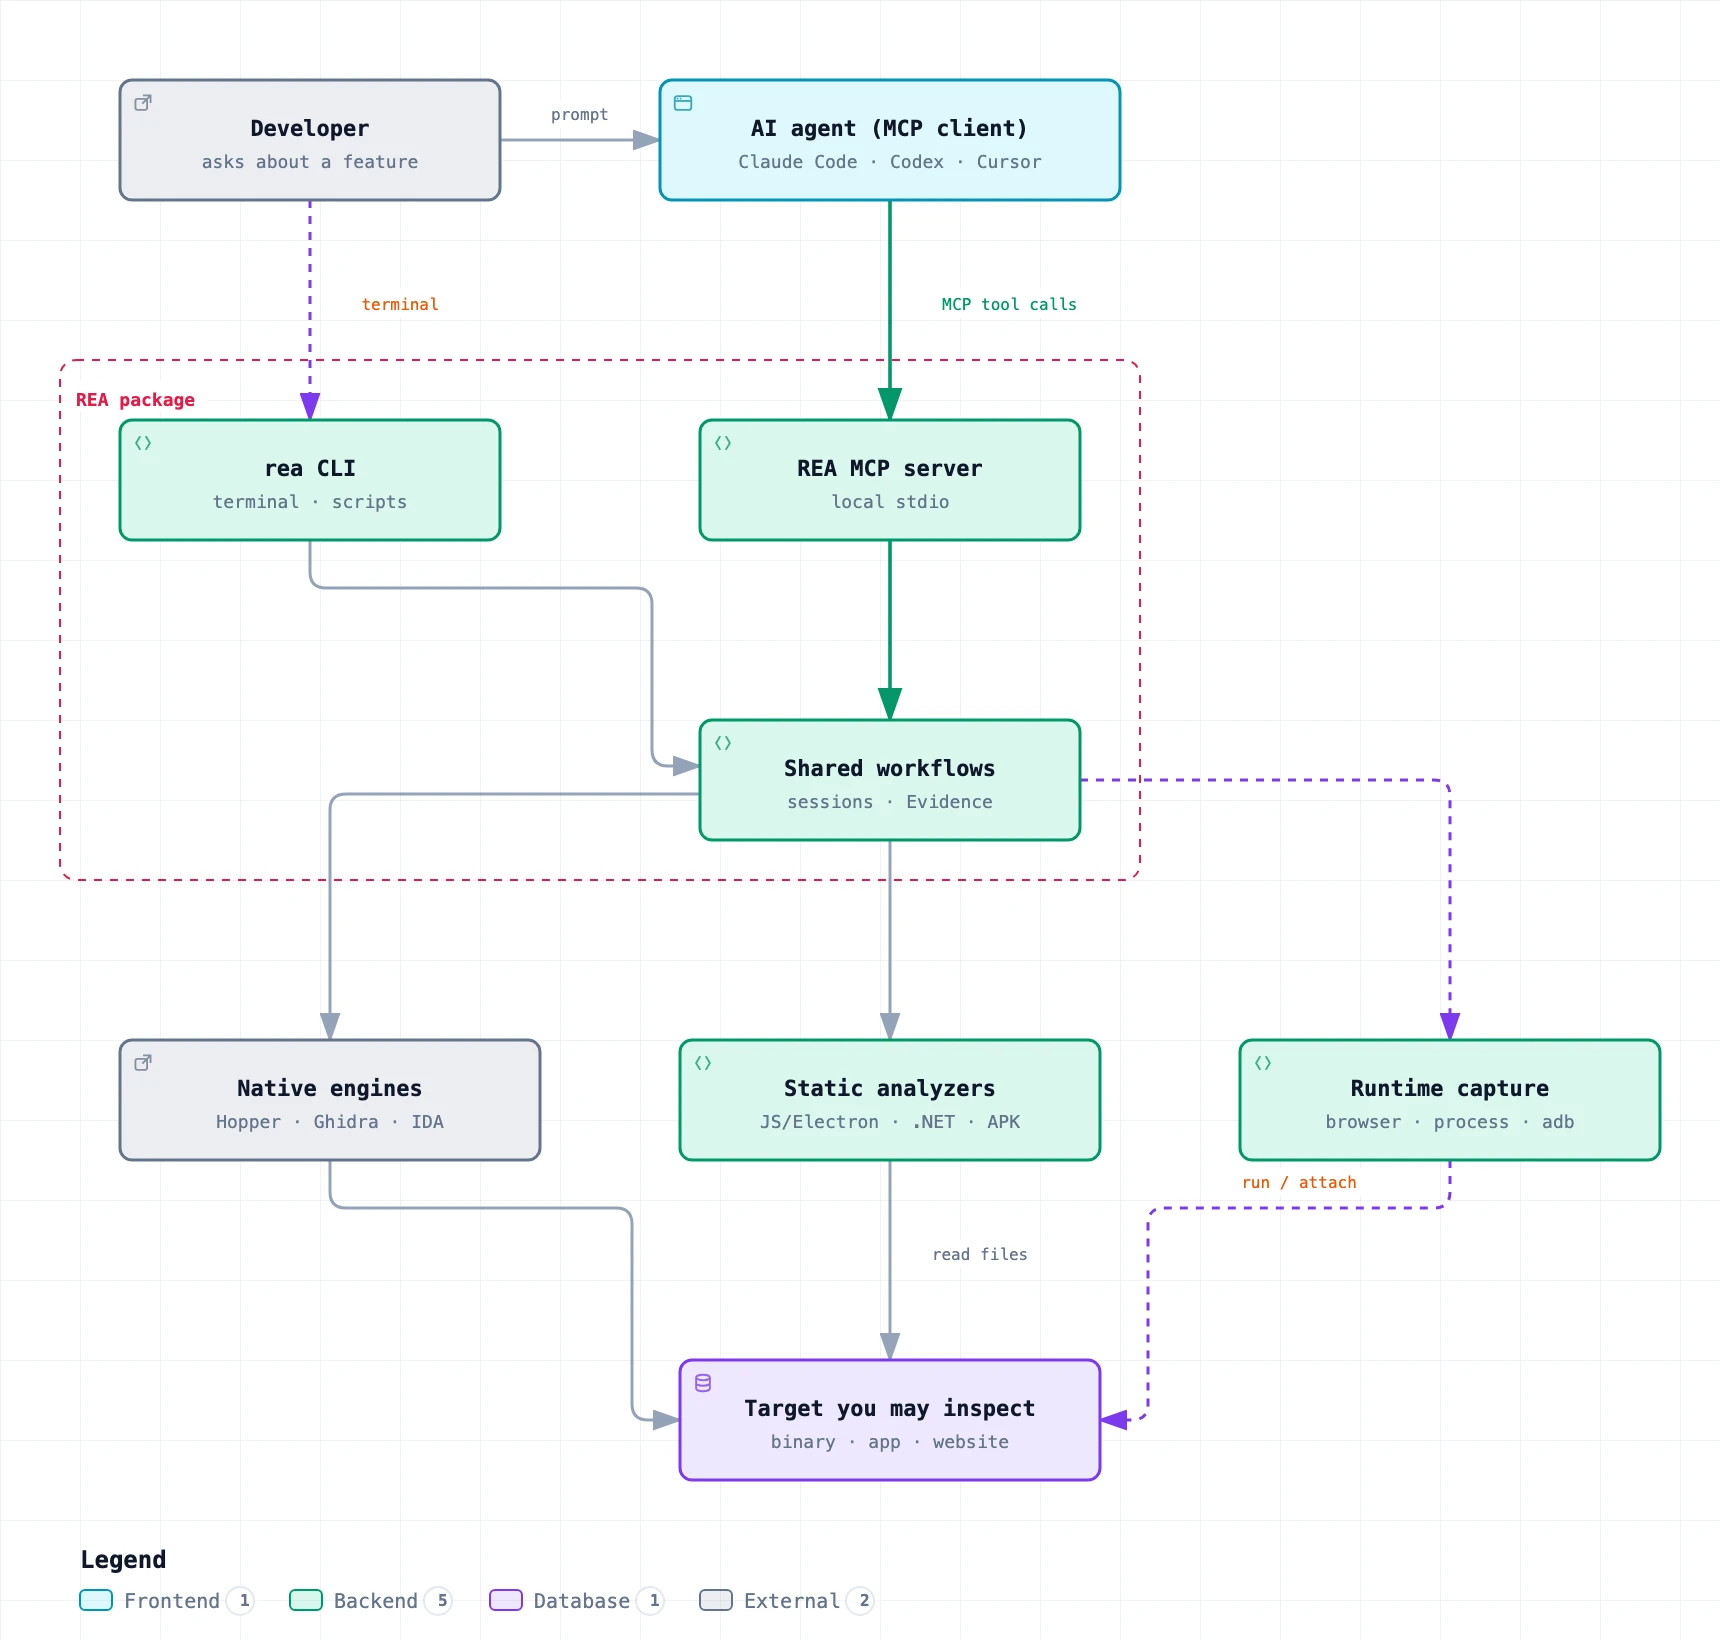
Figure 1. How the pieces fit. The agent talks to REA over MCP; the CLI reaches the same core workflows from a terminal. Analysis runs locally. Dashed paths run or attach to the target, so they can have side effects; solid paths read files.
The MCP server and the rea CLI share the same core workflows and result format, so you can repeat or script an investigation from a terminal. [1, 3]
Too many tools, nothing connecting them
Reverse engineering usually means switching between many tools. You open a disassembler for native code, unpack an Electron archive by hand, run a browser debugger for network traffic, and keep notes about which function talked to which. Every tool has its own interface, and none of them explains what it shows.
An AI agent is good at the reasoning part: forming a guess, choosing the next thing to inspect, and turning low-level code into a plain-language explanation. Without a connector, though, it can only see what you paste into the chat. REA gives the agent direct, structured access to those tools, so it can follow a feature across files and layers by itself. [1]
REA’s results also include where each finding came from (file, address, or source range) and what is still unknown. An agent can then say “this handler is likely called here, but the channel name is computed at runtime” instead of guessing. The project calls these records Evidence. In practice, they let you check the agent’s explanation against the code. [4]
Who gets the most out of it
REA suits people who need to understand software they did not write and who already work with a coding agent:
- Developers who see a feature in another product and want to understand how it works before building their own version.
- Security researchers and CTF players who analyze binaries, Android packages, firmware, or network captures.
- Preservation and interoperability work, such as recovering the logic of an old game or file format. The project’s showcases include a 1990s Windows game and a PC-98 DOS game. [5]
It works with any agent that supports local MCP servers. Setup can configure Claude Code, Claude Desktop, Codex, Cursor, Gemini CLI, Windsurf, GitHub Copilot CLI, VS Code, and many others; other clients can register the server manually. [2]
It is not for analyzing software you have no right to examine. The project’s disclaimer limits intended use to lawful research, education, interoperability, preservation, and software you own or are authorized to inspect. [6] The README adds that users must legally obtain and be authorized to use commercial tools such as IDA and Hopper. [1]
From the screen down to machine code
A single feature can live in several layers at once. Take a desktop app: a button in the interface triggers JavaScript, which sends a message to a main process, which may call native code. REA’s coverage is designed to follow that stack downward. Figure 2 shows the idea; the table after it groups the official target list by layer. [1]
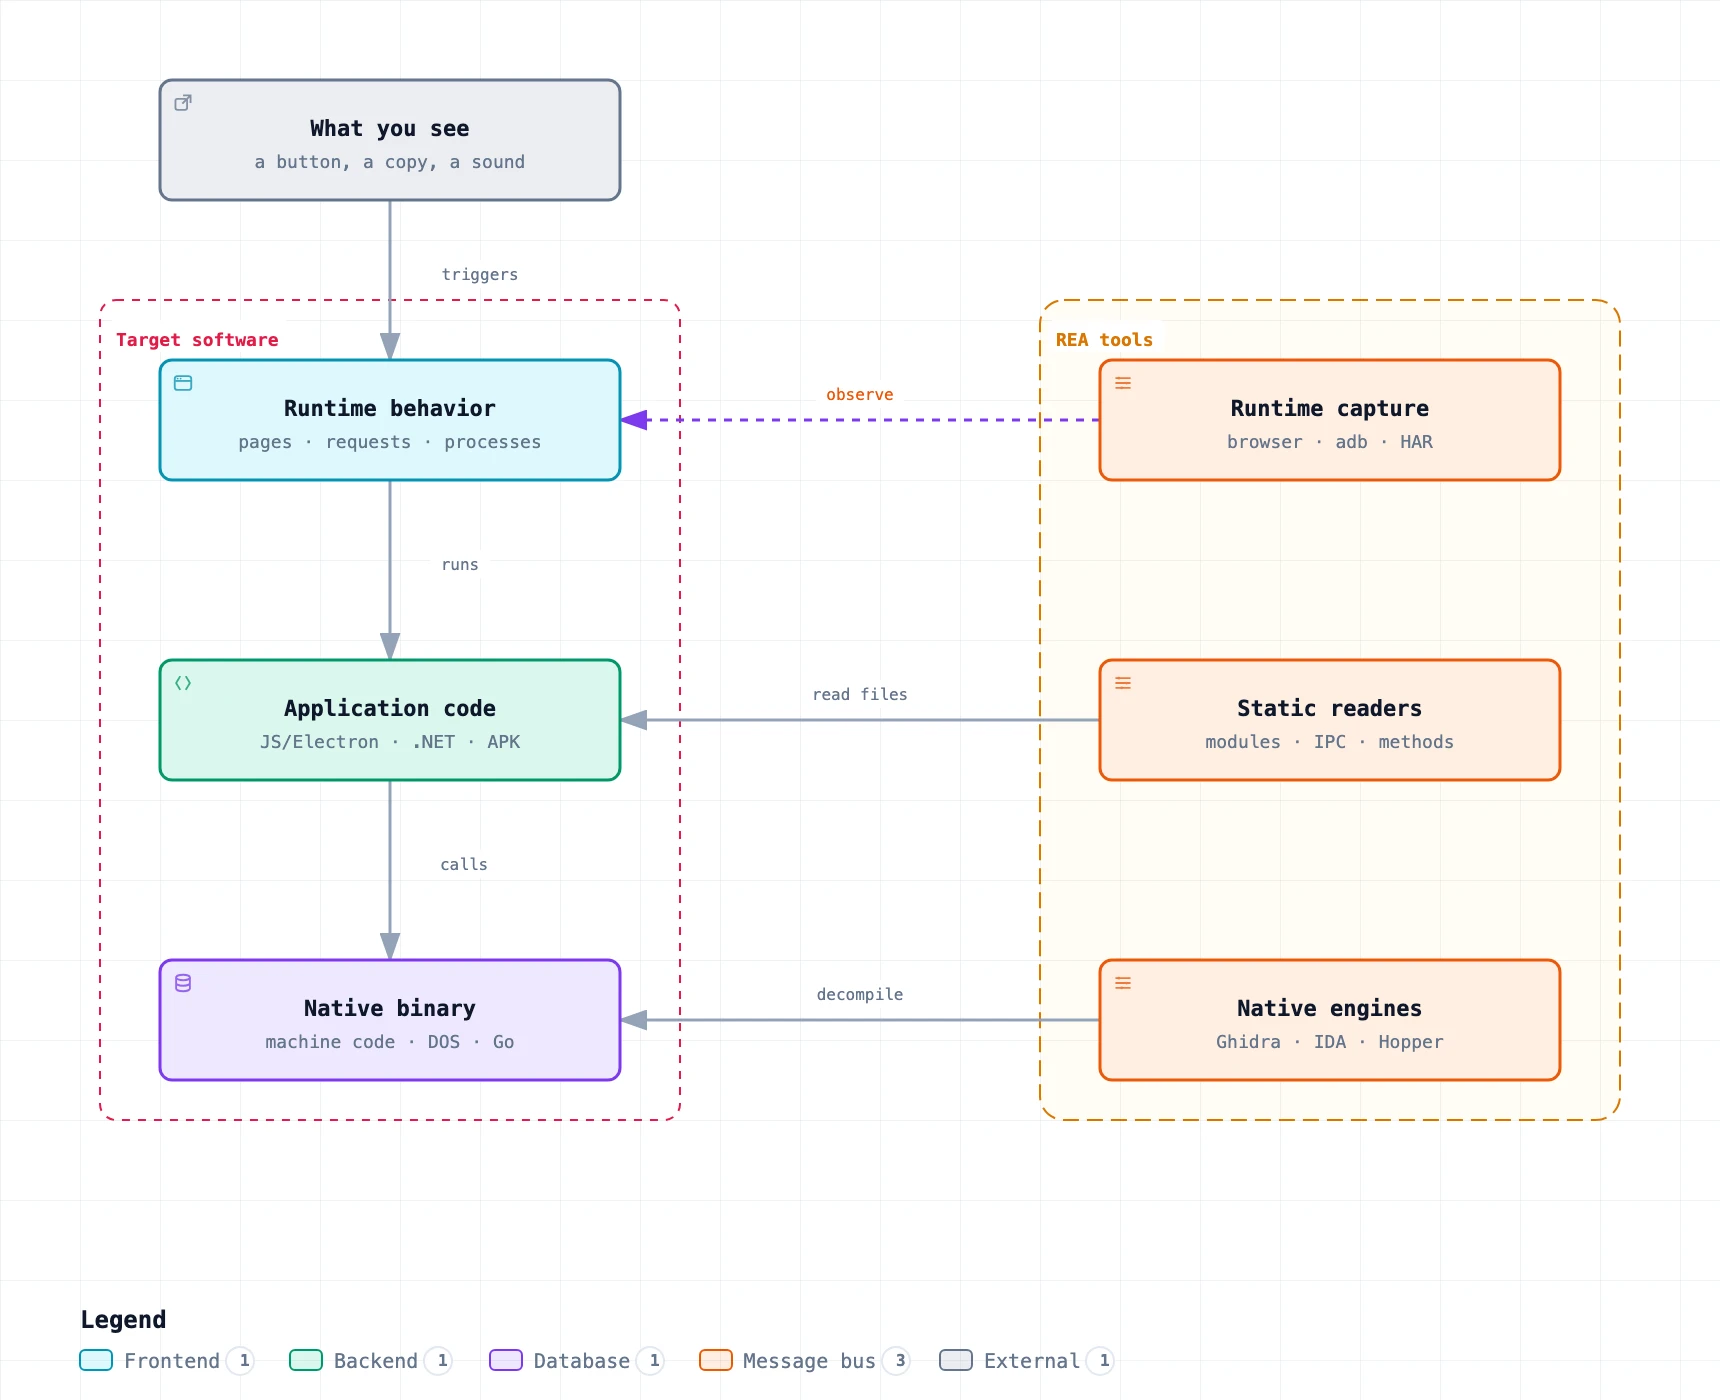
Figure 2. The same feature at different depths. Each layer has a matching kind of REA tool; only runtime capture actually runs the target.
| Layer | Example targets | What REA returns | Extra tools needed |
|---|---|---|---|
| Runtime behavior | Websites, running processes, Android devices, saved HAR/SAZ network captures | Page structure, scripts, network requests, terminal output, file effects | A Chrome-family browser; adb for devices |
| Application code | JavaScript and Electron apps, .NET assemblies, Android APKs, Flutter and WASM artifacts | Modules, imports, IPC channels, routes, classes, decompiled methods, IL | None for JS and .NET; JADX and a JDK for APKs |
| Native binaries | Windows, macOS, and Linux executables, Go binaries, 16-bit DOS programs | Pseudocode, assembly, strings, symbols, calls, and references | Hopper, Ghidra, or IDA |
| Data and artifacts | SQLite databases, firmware images, packet captures, EVM bytecode, app bundles | Tables, extracted regions, protocol fields, contract selectors, file inventories | Depends on format, e.g. Binwalk or TShark on Linux |
Two practical points follow from this table:
- “Anything” means many formats, not every format on every host. Some targets are Linux-only, some need tools you install yourself, and native coverage depends on which engine you use. Check the requirement column for your target first. [1]
- Static and runtime analysis behave differently. Reading JavaScript or .NET files does not run the app. Runtime capture does run or attach to it, using your user permissions, so it can change files or accounts. Use an isolated environment for anything untrusted. [1, 4]
Good fits and poor fits
Good fits:
- You want to know how a specific feature works in a product, without source code.
- You need to trace a path across layers, such as from a UI action through Electron IPC into a main-process handler.
- You are recovering the behavior of an old or undocumented binary and can test your reconstruction against it.
- You already use Ghidra, IDA, or Hopper and want an agent to do the repetitive navigation.
Poor fits:
- You need the exact original source code. Native analysis returns pseudocode and assembly. JavaScript analysis recovers the shipped modules. Your agent writes the reimplementation, and you still have to test it. [1]
- You do not have rights to the target, or the task would bypass protections or licensing.
- The sensitive contents of the target must never reach a cloud model. REA runs locally, but its results go to your agent and its model provider. [1]
REA is also changing quickly. The repository’s version at the time of writing was 6.4.0, and the README advises updating before reporting bugs. Record the version you used so you can repeat an investigation. [1]
Following one feature: Notion’s copy path
The README summarizes the loop in four steps. You ask about a local target. REA inspects and traces it with its analysis tools. It returns code, references, and unknowns. The agent then explains, implements, or tests, and asks follow-up questions as needed. [1]
A published case from the project shows what that loop looks like on a real app. [7]
The question: how does Notion Desktop write rich content to the system clipboard?
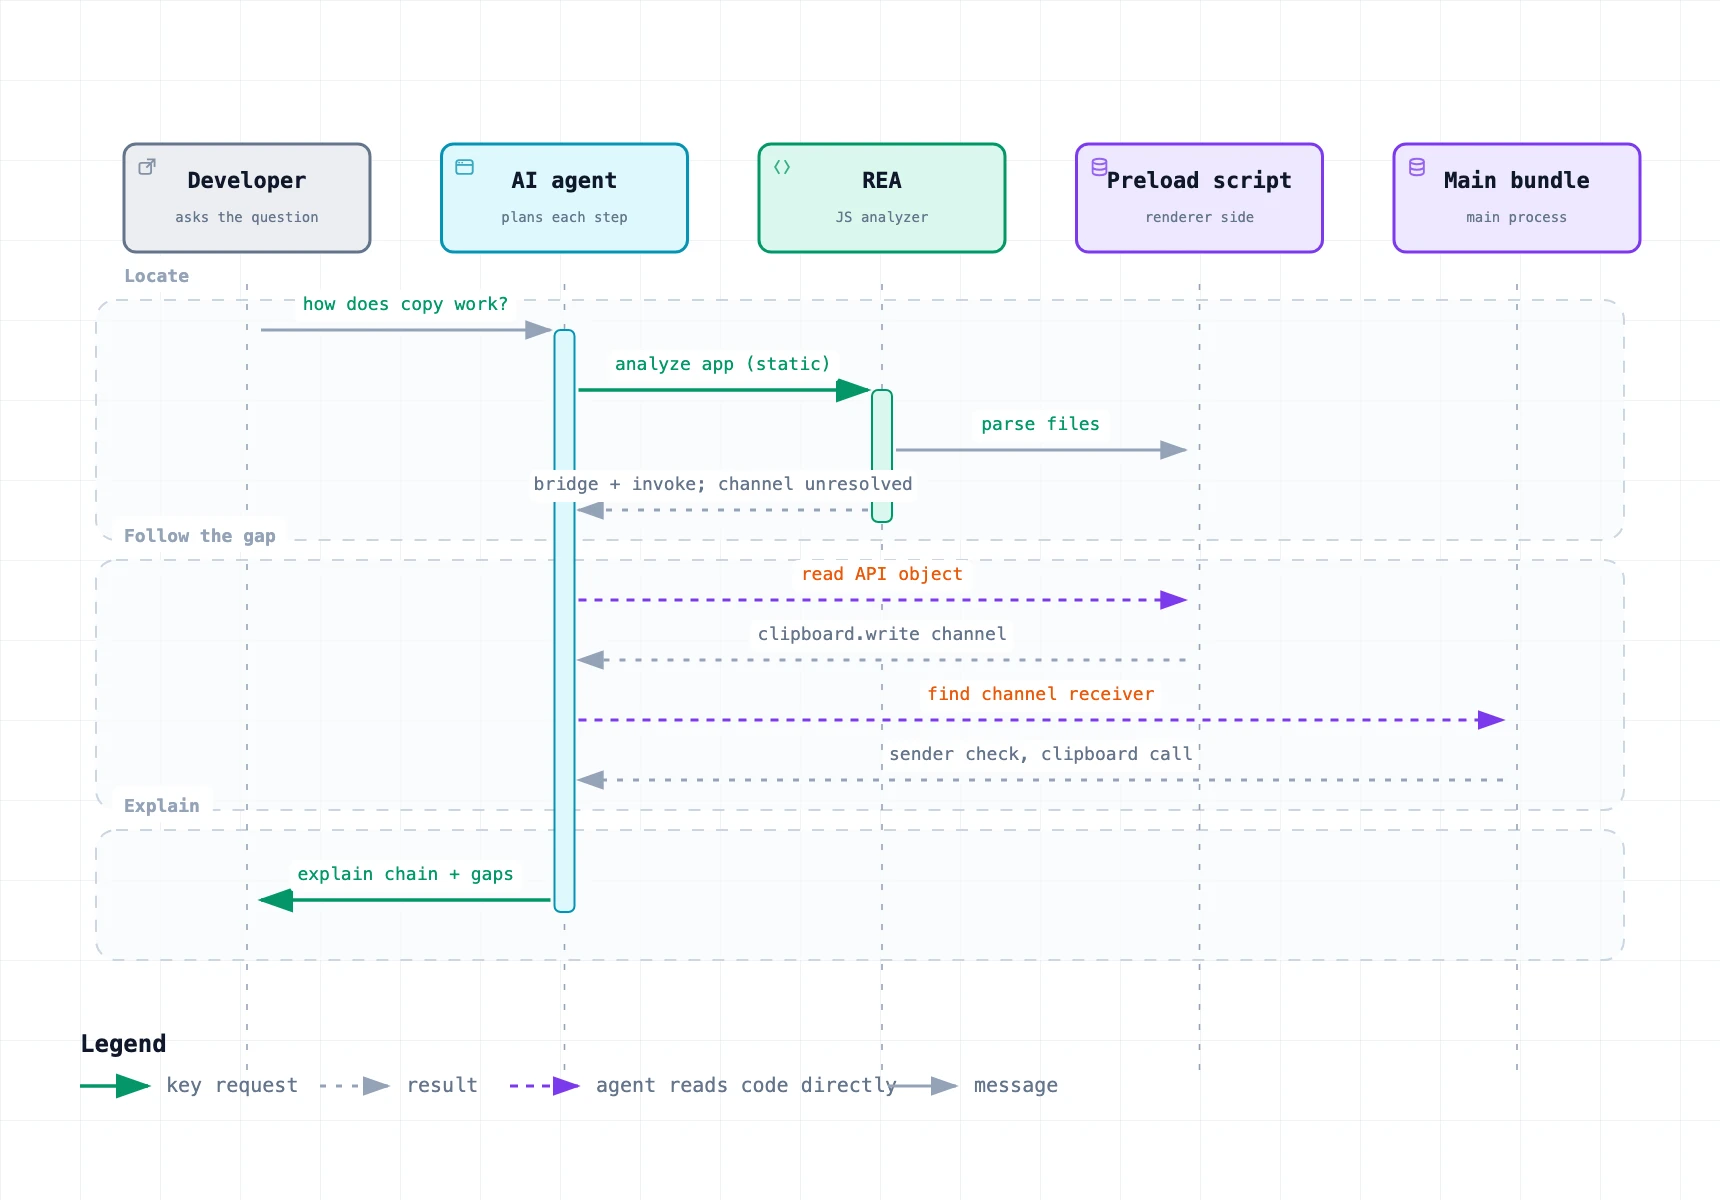
Figure 3. Who does what in the Notion trace. REA finds the bridge and flags what it cannot resolve; the agent reads the code to close those gaps.
- Locate the bridge. REA’s
analyze_javascript_applicationtool inspected the desktop app’s tab preload script without running the app. It reported a context bridge exposed as__electronApiand an IPCinvokecall. For each, it gave the exact line and column range. It also flagged both as partly dynamic: the API members and the channel name could not be resolved statically. - Follow the gap. Because REA marked those parts as unresolved, the next step was clear. Reading the packaged API object revealed a
clipboard.writemember. That member sends a literalnotion:clipboard:writechannel. - Cross into the main process. Reading the main-process bundle connected that channel to a receiver. The receiver checks which page sent the message and then calls Electron’s
clipboard.write. - Explain or rebuild. With that chain mapped, an agent can explain the design: renderer API, IPC channel, sender check, native clipboard call. It can also implement a similar bridge in your own Electron app and test it.
The case notes are explicit about scope. The four-step path combines REA’s static result with manual reading of the wrapper code; it is not an automatically paired IPC graph or a recording of the app running. [7] That is a fair picture of normal use: REA narrows the search and marks the gaps, and the agent (or you) closes them.
The same loop works at the native layer. In the project’s DX-Ball case, Ghidra’s decompiler output for a 63-byte sound-panning function missed the input parameter and the floating-point math. The agent read the assembly, the calling code, and the constants in memory to recover the formula. The project reports that its rewritten C passes 3,205 test cases against the original x86 code and compiles back to the same 63 bytes. [1, 5] That result covers one function, not the whole game, and like the Notion trace it comes from the project’s own write-up rather than a rerun on our side.
Trying it on your own app
You need Node.js 22.19+, 24.11+, or 26+, plus npm. [1]
1. Register REA with your agent.
npx rea-agents setup
Setup shows the configuration changes it will make, asks for approval, backs up existing settings, and installs matching workflow instructions for your agent. Restart the agent afterward. [1, 2]
2. Ask a scoped question. For example:
I am authorized to inspect this Electron app at /path/to/app.
Using static analysis only, find how the "Export report" feature works.
Show the relevant modules, IPC channels, and source locations,
and list anything you could not resolve.
Starting with static analysis keeps the first pass read-only. Move to runtime capture only when a question needs it, and do that in an isolated environment.
3. Or use the terminal directly. The same JavaScript analysis is available as a one-off command:
npx -y rea-agents@latest analyze-javascript-application /absolute/path/to/app --json
For native binaries, configure Ghidra, IDA, or Hopper first; the CLI guide covers provider selection. [3]
REA FAQ
What is REA (Reverse Engineer Anything)?
REA is an open-source MCP server and CLI that connects AI agents to local reverse-engineering tools. The agent asks questions about an app or binary; REA runs analyzers such as Ghidra, IDA, Hopper, or its built-in JavaScript and .NET readers and returns code, locations, and open questions.
Is REA the same thing as MCP?
No. MCP (Model Context Protocol) is the standard way an agent calls external tools. REA is one MCP server: it exposes reverse-engineering tools over that protocol, and the same workflows are also available from its rea CLI.
Do I need Ghidra, IDA, or Hopper?
Only for deep native analysis of compiled binaries. Static JavaScript/Electron and .NET inspection work without a native analysis engine. Setup can install Hopper after approval; Ghidra and IDA use your existing installations.
Does REA upload my app?
REA analyzes targets locally, but its results go to your agent, and the model provider behind that agent has its own data policy. Review sensitive results before sharing them with a cloud model.
References
- morluto/rea. “README.” GitHub, v6.4.0.
- morluto/rea. “Installation guide.” GitHub, v6.4.0.
- morluto/rea. “CLI guide.” GitHub, v6.4.0.
- morluto/rea. “MCP contracts.” GitHub, v6.4.0.
- morluto/rea. “DX-Ball sound-panning case notes.” GitHub, v6.4.0.
- morluto/rea. “Disclaimer.” GitHub, v6.4.0.
- morluto/rea. “Notion clipboard case notes.” GitHub, v6.4.0.